Here is a typical picture that may be produced by an ESM system.
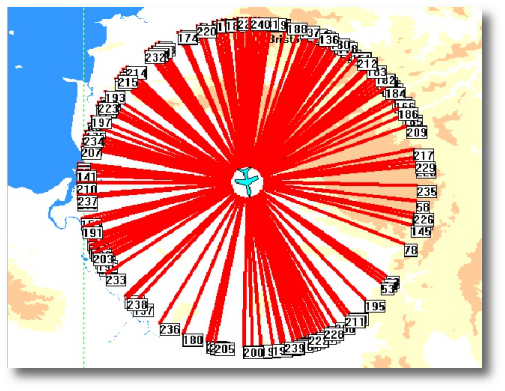
There are many complicated processes in the production of an ESM picture and
the analysis of the ESM system performance is a pain-staking and time-consuming
business.
Pulse Parameters
Parameters of the pulses which are measured by the ESM are:
- Radar Frequency (RF)
In GHz and typically in the range 0.5 to 40 GHz. Radars operate with fixed RF or with Frequency Agility where they change RF from pulse-to-pulse ( or from one group of pulses to another group of pulses) in a fixed or pseudo-random pattern.
- Pulse Width (PW)
Measured in microseconds and is typically in the range 0.1 microseconds to 200 milliseconds.
- Time of arrival
Typically to at least 10 nanosecond (ns) accuracy.
- Amplitude
In dBmi or dBW/m2, ranging from the ESM sensitivity level (e.g. -40 dBW/m2 or -80 dBmi) to the saturation level (e.g. 5 dBW/m2)
The pulse parameters which are calculated by the ESM are:
- Angle of Arrival (AOA)
Calculated using amplitude comparison, time difference of arrival or phase comparison techniques and then usually converted into Direction of Arrival (DOA) which is relative to North.
- Pulse Repetition Interval
PRI is the time between pulses emitted by a radar and can be in the range of a few tens of microseconds to a few tens of milliseconds.
- Scan Period
This is the time that the radar scan pattern takes to repeat itself. For example, a radar with a circular scan may have a scan period of a couple of seconds or a more complex scan pattern may repeat only a couple of times a minute.
Frequency Agility
The RF signal emitted by a radar can be fixed, or agile from pulse-to-pulse or from batch-to-batch. Some agile signals follow a specific pattern of changing RF from pulse-to-pulse or from batch-to-batch, whereas others change RF on a pseudo-random basis.
The extent of RF agility varies from just a few MHz difference between the RF levels to hundreds of MHz difference between maximum and minimum values of RF in some cases. Some radars have up to 20 different RF levels available, with tens of MHz difference between levels.
In general radars with differences in RF of more than 20MHz between RF levels are batch-to-batch agile, while those with smaller RF differences between levels are pulse-to-pulse agile.
Radars which have batch to batch RF agility often have switch and dwell PRI patterns so that the PRI changes at the same time as the change in RF.
Pulse Repetition Interval
The Pulse-Repetition Interval (PRI) of a signal is an important parameter both in the de-interleaving and identification stages of ESM processing. PRI types are can be classified as fixed, staggered or jittered, with pulse groups (doublets or triplets) used for some applications such as missile guidance. PRI is the inverse of Pulse Repetition Frequency (PRF).
- Fixed PRI
Some emitters operate with a simple fixed PRI. The range of PRI values varies from a few tens of microseconds to several milliseconds.
- Staggered PRI
Most emitters operate a staggered PRI sequence. The number of elements in a staggered PRI sequence can vary from two elements to tens of elements emitted in a complex sequence. Typical elements in a staggered sequence have values in the range 100 microseconds to 10 milliseconds.
- Jittered PRI
In this type of PRI a single PRI element is varied by a few percent from a mean value on the emission of each pulse. For example, a PRI of 600 microseconds which is jittered by ±5% may change by up to 60 microseconds from pulse to pulse.
- Switch & Dwell PRI
A set of pulses is emitted at one PRI, then the PRI is changed for the emission of the next set of pulses. Pulse width changes often occur in conjunction with PRI changes in an attempt to maintain a constant duty cycle for a particular radar.
Techniques for Angle of Arrival Measurement
There are three techniques in general use for the measurement of the angle of arrival of radar signals
- Amplitude Comparison
The Angle of Arrival (AOA) of a pulse is determined by measuring the relative amplitude of the signal received by two or more antennas whose boresights are squinted relative to each other.
This provides relatively coarse AOA, but is typically easy to arrange to provide the necessary spatial and frequency coverage.
Theoretical calculations suggest that a 4-port amplitude comparison system can deliver bearing accuracies to the order of 10° rms whilst a 6-port arrangement might be expected to deliver 4-6° rms accuracy at high signal levels
- Time Difference of Arrival
Time Difference of Arrival (TDOA ) systems rely on the measurement of the time of arrival of single pulses at each of the ESM antennas, usually located near the extremities of the platform, to determine the angle of arrival of a signal.
This type of system is often implemented on large aircraft where the distance between antennas is great enough to allow a DOA calculation with good resolution ( ~ 1 nanosecond) to be carried out using the time of arrival at each antenna. - Phase Comparison
In phase comparison systems the Angle of Arrival (AOA) is found by measuring the relative phase difference of the signal received by two or more antennas in an array.
In theory this approach can provide DOA of 1 degree rms. To avoid ambiguity in AOA measurement, multiple antennas are needed.
De-interleaving
De-interleaving is the process of sorting pulses from different radars into individual sets of pulses (an intercept), one for each radar. The simplest de-interleaving technique is the construction of a grid with RF on one axis and DOA or DTOA on the other. Here is an example of such a grid.
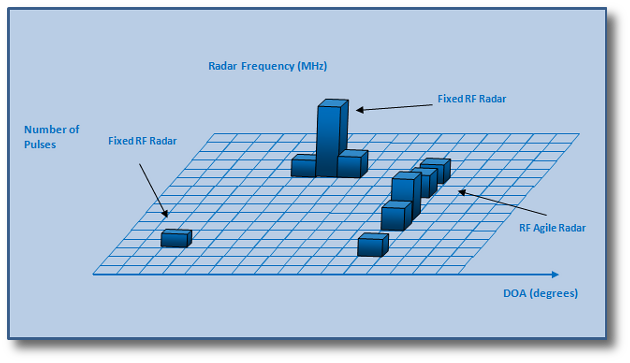
There are four clusters of pulses shown in the picture, each of them has been
received from a different radar. If there is more than one cluster at the
same DOA or DTOA there is a possibility that the pulses from the clusters
have come from a RF agile radar.
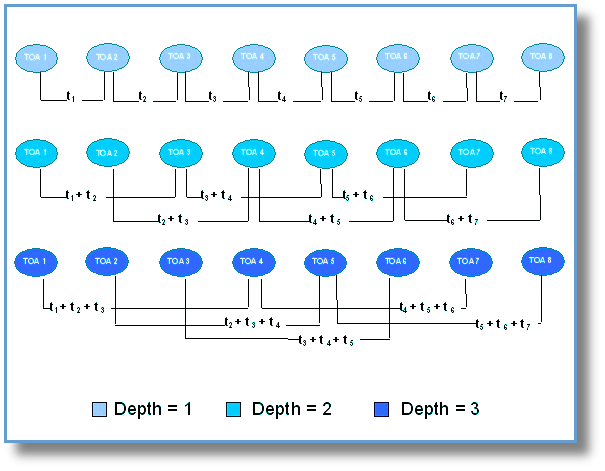
Once the pulses have been assigned to intercepts, the Pulse Repetition Interval (PRI) can be calculated using a technique such as Time of Arrival Difference (TOAD) histogramming.
The following diagram shows how the PRIs are calculated
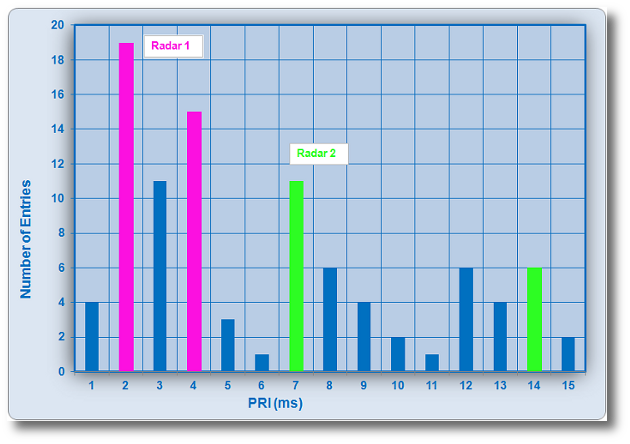
Here is an example of the TOAD histogram which has peaks from two radars.
The correct determination of PRI often proves to be the main
stumbling block in the operation of an ESM, often leading to multiple tracks
being in existence simultaneously for a single radar, or that tracks are derived
from intercepts received from more than one radar. The consequences of these
limitations are that the RWR does not produce a true picture of the RF environment.
The ESM Picture
The ESM picture contains "tracks" or "Lines of Bearing" which indicate the direction of arrival (DOA) of a radar signal to the ESM platform and sometimes "fixes" which show where the ESM thinks that the radar is located.
A typical ESM picture might look like this:-
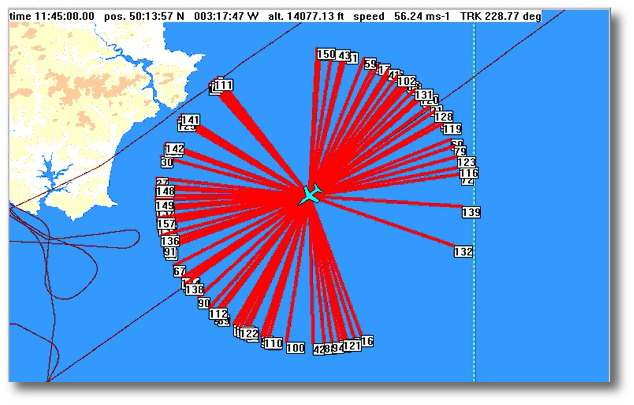
If the ESM produces fixes, it is usual for the display to include
an error ellipse which shows the ESM confidence in the calculation of the
radar location.
The ESM will contain a library of radar signatures consisting of parameters such as Radar Frequency (RF), Pulse Width (PW) and Pulse Repetition Interval (PRI) so that the tracks can be identified and alerts can be set up when threat radars are detected.
